


Trends in local lines company performance
This page was updated2 days ago
We have released a breakdown of revenue and reliability trends for local lines companies.
You can learn more about the industry and your local lines company in our dashboard and trends report.
The performance trends have been produced from data that the 29 local lines companies are required to publish in accordance with our information disclosure requirements for the industry.
Read more
Trends in local lines company performance – 25 June 2024 PDF (3 MB)Read more
Approach to trends analysis of local lines companies report – 25 June 2024 PDF (784 KB)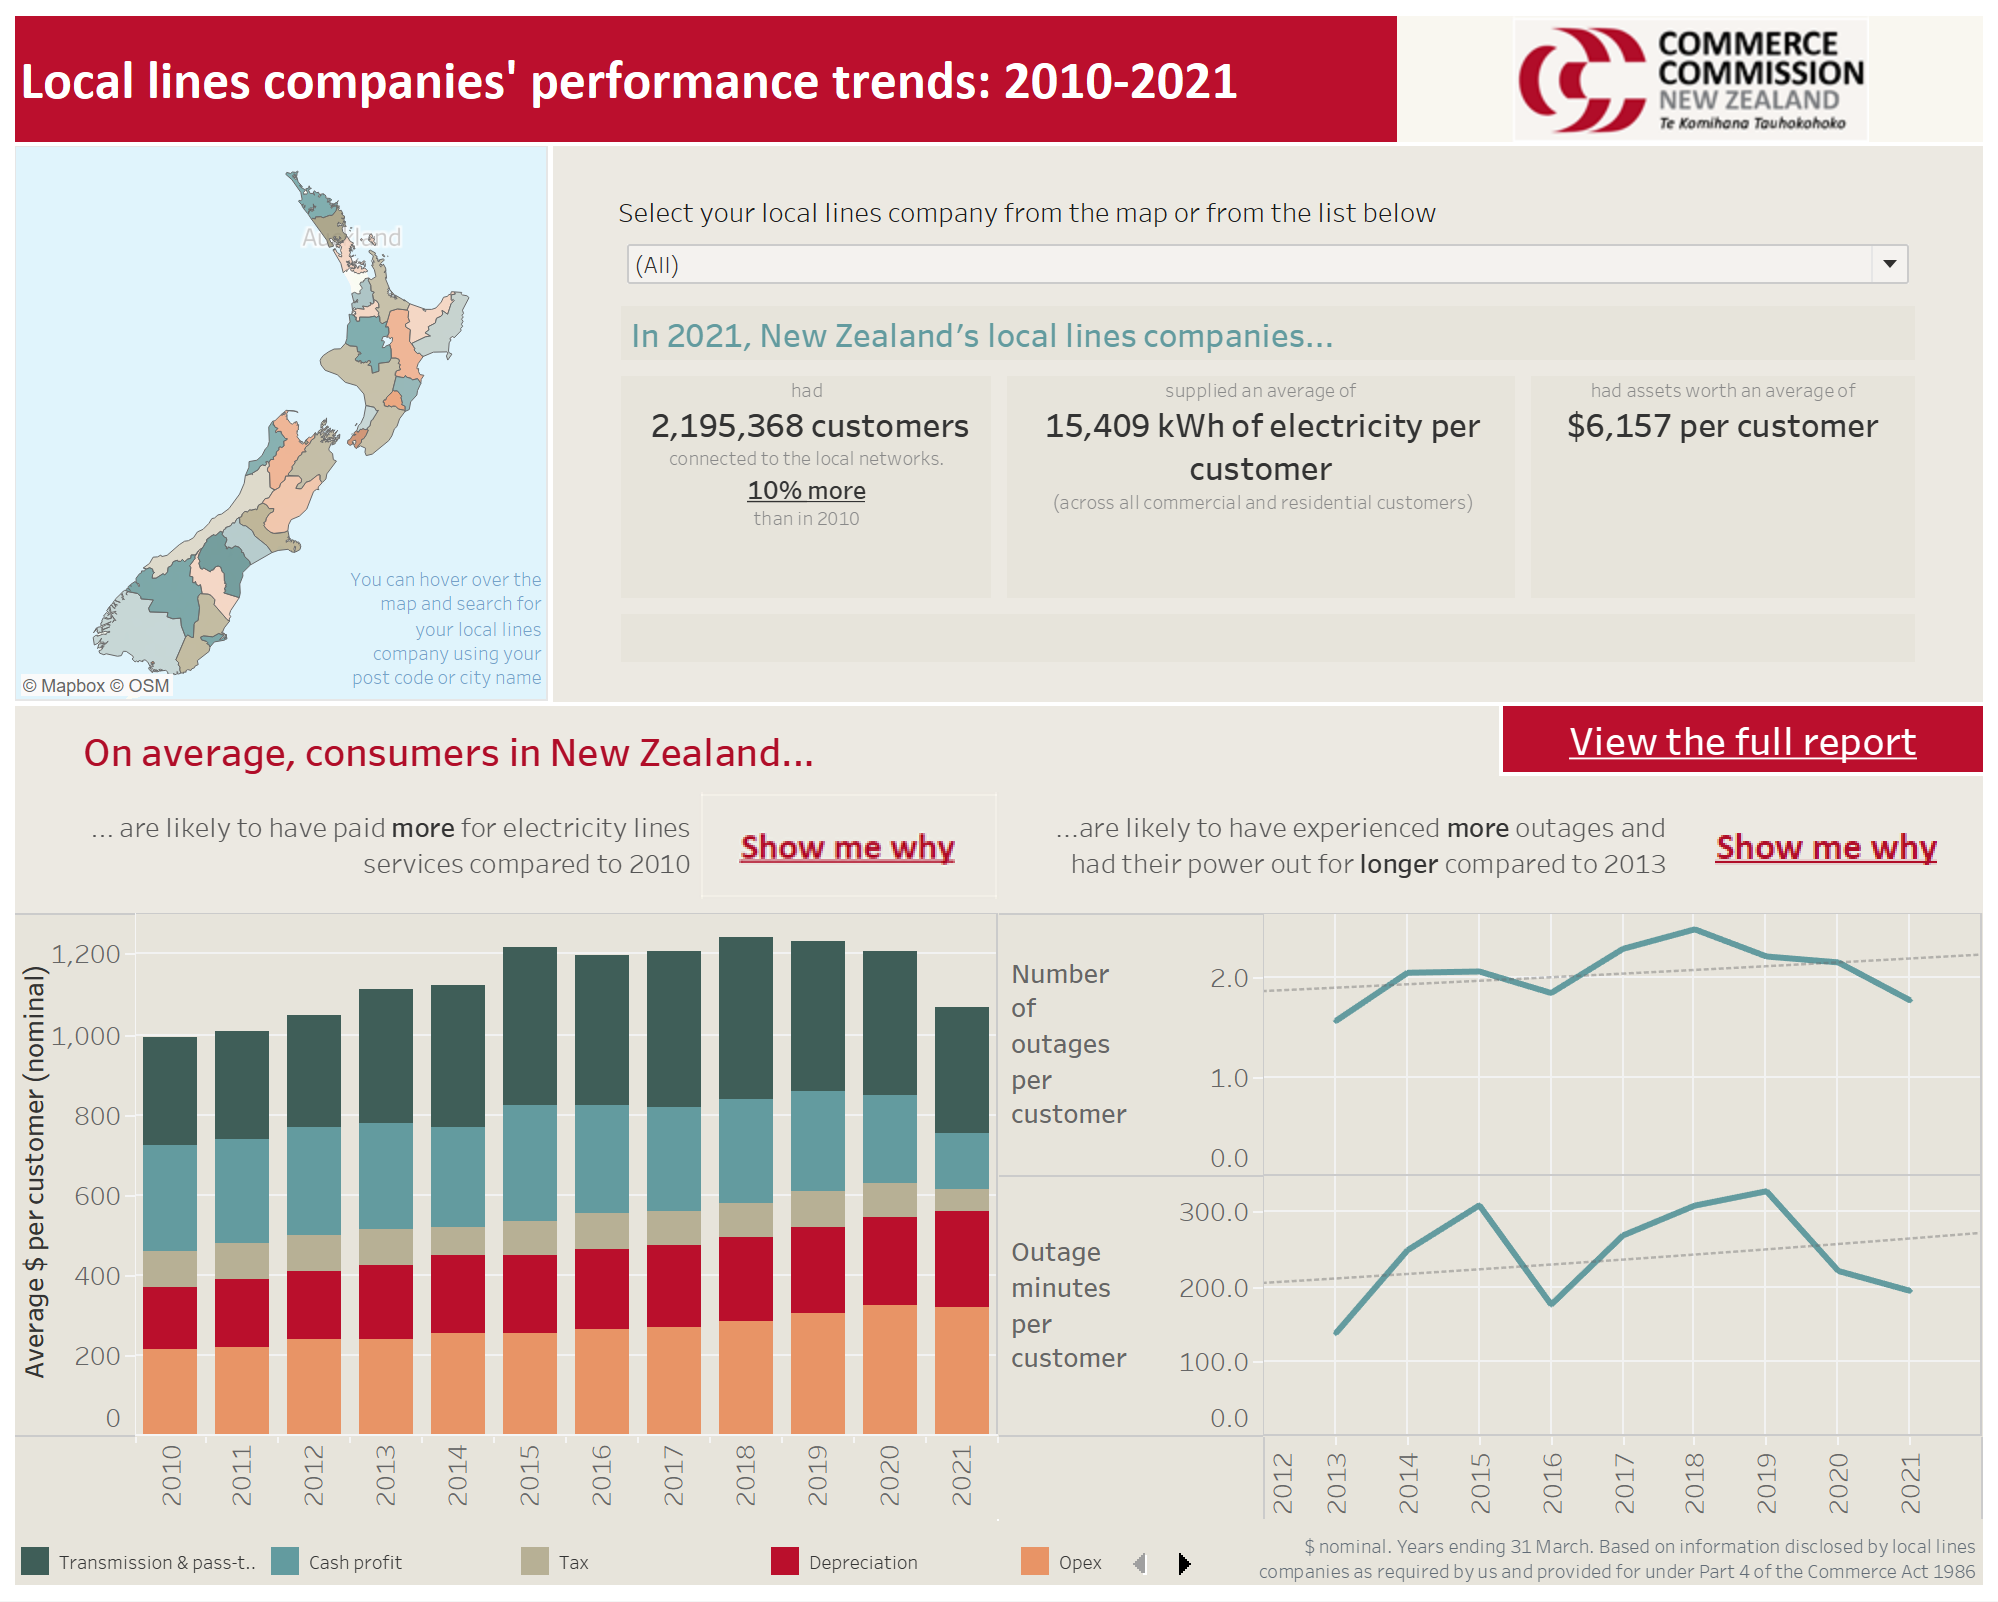 Local lines companies' performance trends dashboard
Our dashboard is an interactive tool that allows you to visualise and interact with the data in real time.
View dashboard of resultsPlease note: there are viewing issues in some versions of Internet Explorer. We recommend using an alternative web browser such as Google Chrome or Microsoft Edge for the best experience.
Below is a snapshot of revenue, profitability, and service reliability trends for local electricity lines companies in New Zealand.
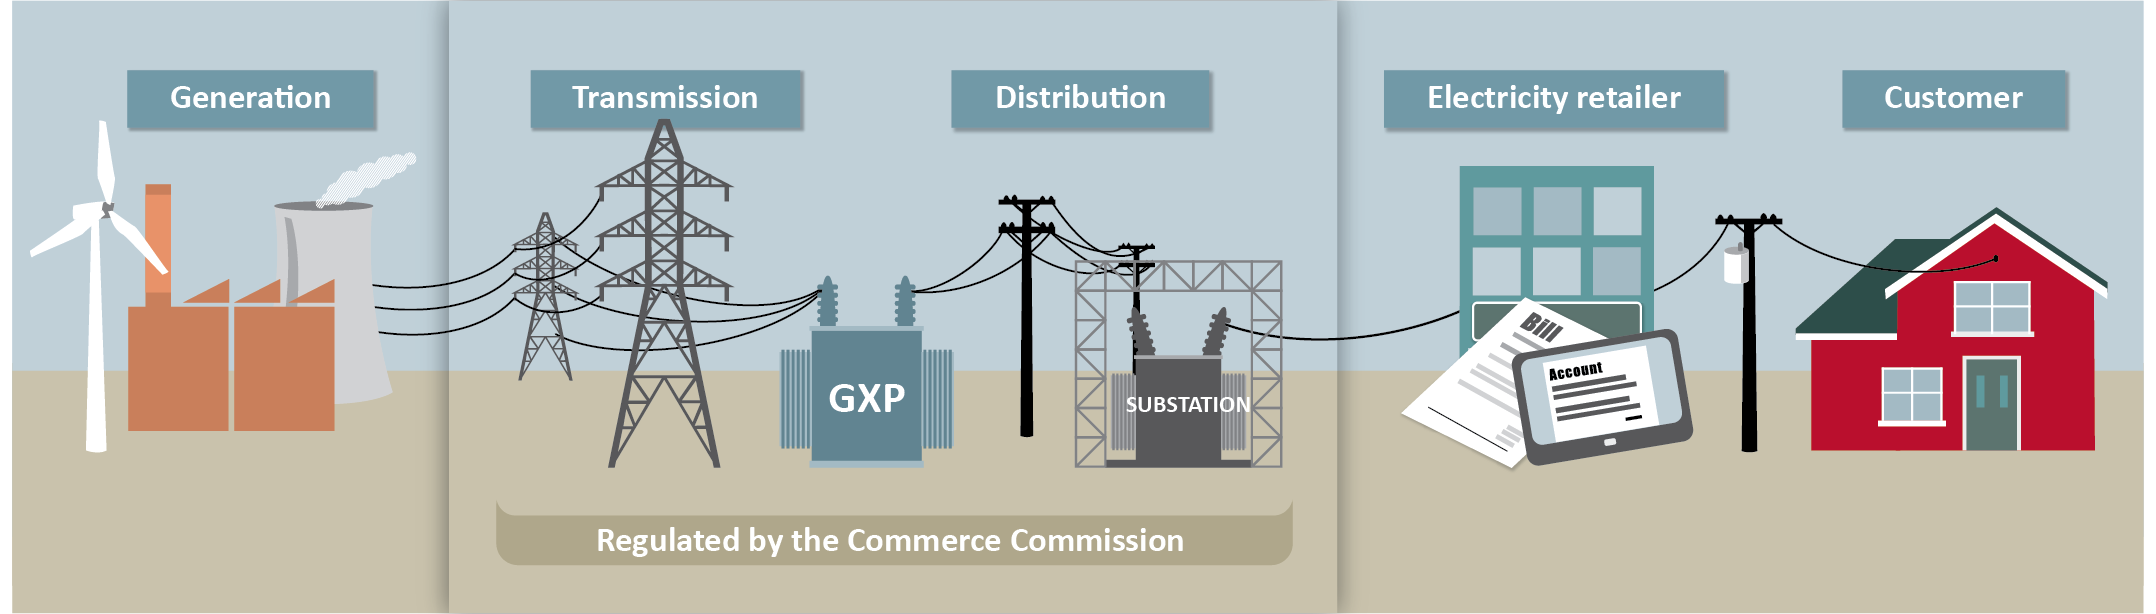
Local lines companies provide electricity distribution services. They own the poles and wires around cities, towns and rural areas, which deliver electricity from the high-voltage transmission system, as well as local generators, to households and businesses.
We regulate local lines companies
Under Part 4 of the Commerce Act, we regulate local lines companies and transmission services because they are markets where there is little or no competition (and little prospect of future competition).
There are 29 local lines companies and one transmission provider, Transpower. Transmission and distribution lines charges combined make up approximately 38% of the average consumer electricity bill. We require local lines companies to disclose information on their performance and, for 16 of them, we also set maximum revenue limits and minimum quality standards every five years.
Lines charges have fluctuated over time and have fallen in real terms per customer
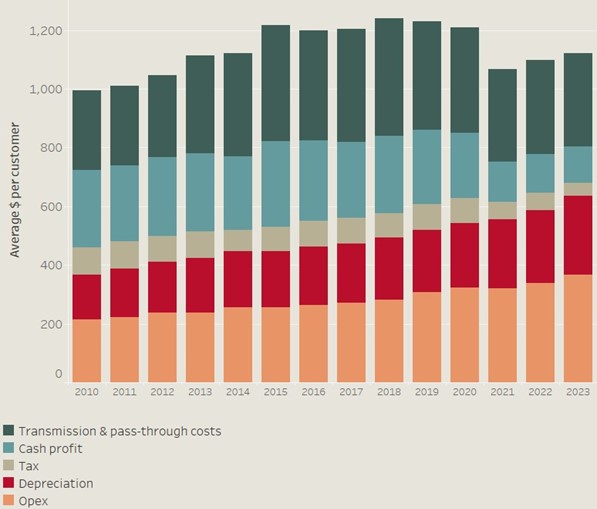
Local lines companies collect their regulated revenue through lines charges. In nominal terms, lines charges have fluctuated over time. Lines charges increased for 10 years between 2008-2018 to pay for significant investment in the transmission network, growth in distribution networks, and replace aging distribution assets. Lines charges have remained steady between 2018-2020 and decreased in 2021 – the main factors causing the decrease were lower inflation and cheaper finance. In 2021, our reset of maximum revenue limits came into effect for 16 of the 29 lines companies for the period 2021-2025. Lines charges then increased in 2022 and 2023.
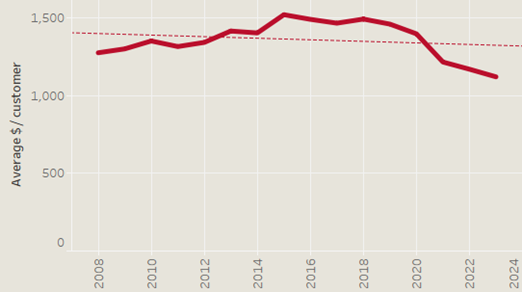
In contrast, in real terms (adjusted for inflation), lines charges per customer have decreased by around 17 percent between 2010-2023. This has meant that individual customers have paid less for lines companies’ services over the period.
The charts below show a breakdown of lines charges (in nominal and real terms).
-
Average lines charges per customer (nominal terms)
-
Average lines charges per customer (real terms)
The reliability of local lines companies
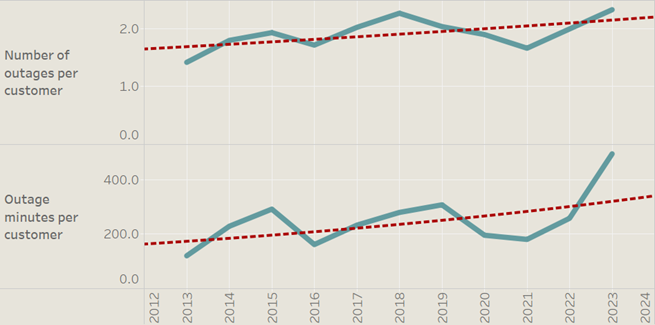
Network reliability has changed over time as shown in the chart below. Outages are categorised as planned (notified in advance) and unplanned. Planned outages allow work to be done on the network, while unplanned outages are caused by external factors like weather events.
Overall, the long-term trend between 2013-2023 shows that there have been more outages in total and each outage lasts longer. The long-term trend of the annual increase in the average number of outages per customer per year is 2.4%, and for the average total length of outages per customer per year, it is 6.2%.
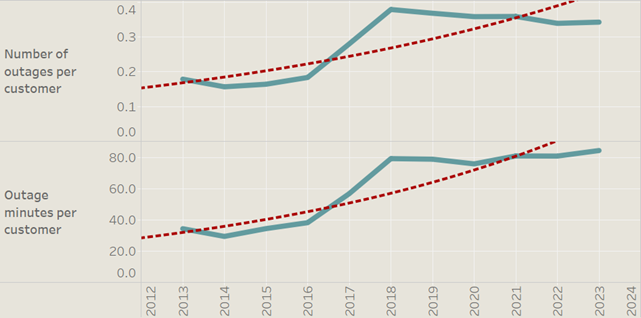
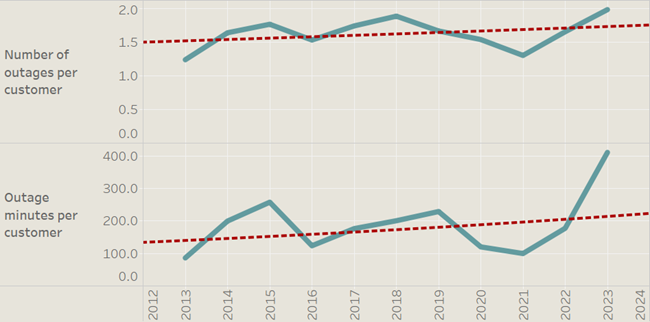
Planned outages have increased more than unplanned outages over time as shown in the two corresponding charts below. Unplanned outages have been broadly similar over time, except for 2023 when there has been a significant increase due to severe weather events - Cyclone Gabrielle and the Auckland Anniversary flooding.
Total outages per customer
-
Planned outages per customer
-
Unplanned outages per customer
Why did the Commerce Commission conduct this analysis?
Part of our role is to require the lines companies to disclose information about their performance and for us to share our analysis of that performance. This set of analysis looks at the changes in prices over time and explores the causes of those price changes. It also assesses the changes in reliability over time.